Dogs of New York
A visualization of some of New York's most photogenic dogs
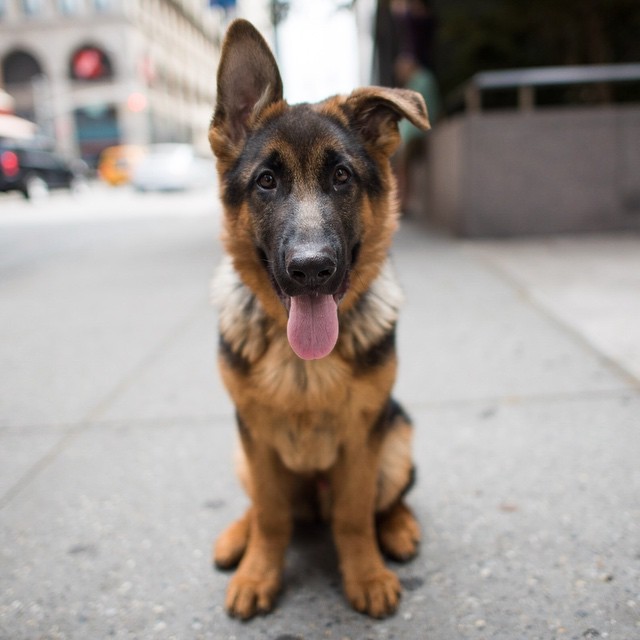
Bruno, German Shepard, 8th & Broadway, NY, NY
About
Background
The Dogist was created by Elias Friedman, a photographer that took to the streets of New York City in 2013. Since then, Elias has been posting photos of some of the dogs he encounters daily around New York City. Over the past two years the blog has picked up a significantly large audience. With its primary social media outlet being Instagram, The Dogist has about 1.6 million followers today.
This is what a typical Instagram post looks like:

You'll notice that in the caption the name, breed, and location of where the photo was taken are included.
Methodology
Dogs of New York is a visualization of some of The Dogists’ photos. The goal of this project was to answer the following:
1. Where are these dogs being photographed?
2. What kinds of dogs are being photographed?
3. How does the audience interact with these
   dogs through social media?
Inspiration
The inspiration from this project came from the fact that I really enjoy this blog, and that I have never been to New York. Everyday is see The Dogist's posts on Instagram, and I would wonder where exactly these photos were being taken. I decided that I would really love to investigate this curiosity more, and that a visualization of the dogs' location could be quite interesting.
Process
First, I narrowed the 2 years worth of posts to 3 months, May, June, and July of 2015 to use for my visualization. I took all the information from the caption of these photos and made an excel chart with it using Name, Breed, Location, Age, and Notes(likes) as column headings.
Next, I uploaded the database into Google Maps; thankfully it was able to geocode the locations provided in the photo captions.
Challenges and Setbacks: - The locations given in the comments of the photos are usually very generalized, like two cross roads, or a park. Thus, the points on the map are not very true to the actual location to where the photo was taken. -In order to get the photos to appear with the point, I had to go through every dog and link the image URL to it through Google Maps. - Trying to use Google Earth to timecode my data and enable my points to be plotted on a timeline. After failing with Google Earth I tried using CartDB's timeline feature, however, not all my points could be geolocated on CartoDB.
Presentation
I decided to present my project as a website for two reasons:
1) I wanted to keep with the continuity of the actual The Dogist. The theme of the blog is very simple, black and white with bold text. I wanted to my project to be seen as a good reflection of the blog that inspired it.
2) I have never used GitHub and it is really simple to use. Although GitHub gave me its own challenges seeing as I have never really coded before, it was really fun to figure out. I enjoyed working in it, and how it displayed my project.
The Map
Things to note: - The months are represented with different colored points - Searching Breeds, or Names, allows for a more selective search
The New York Times posted an article about trends seen in breed popularity based on NYC zip code. NYT Top Dogs of NYC
Graphs
Location,Breed,Name x Age,Notes
The Y-axis displays Location, Breed, and Name while the X-axis displays the amount of likes according to Age. I decided to group the categories like this to analyze trends in follower interaction with these photos. This format also allows for analyzation of likes per photo based one location of the photo taken.
Tableau workbook is available for download.
Conclusion
dogs are cool
Trends
- Photos of younger dogs tend to have more likes
- Photos are usually taken near parks in NYC
Limitations
- Data from 3 months verses 3 years
- Photos are very selective, you can only make very vague generalizations from the trends
- Not all the data is displayed, sometimes information was not given in the caption, so those photos were omitted
Overall, I would not say the information on the map is an accurate representation of dog popularity in New York as I had orignally hoped. There are just way too many limitations to the data. For example, the photos are being taken by one person and could be subjected to dog breed bias. If I were to expand this project to include 3 years worth of photos, I would be curious to see if there actually is a better correlation between the New York Times article and the popularity of dog breeds in some photos. Perhaps a bigger database would reveal those kinds of trends.
Data
The Dogist_May .xlsx The Dogist_June .xlsx The Dogist_July.xlsx
Resources
Made With
Google Maps
Tableau